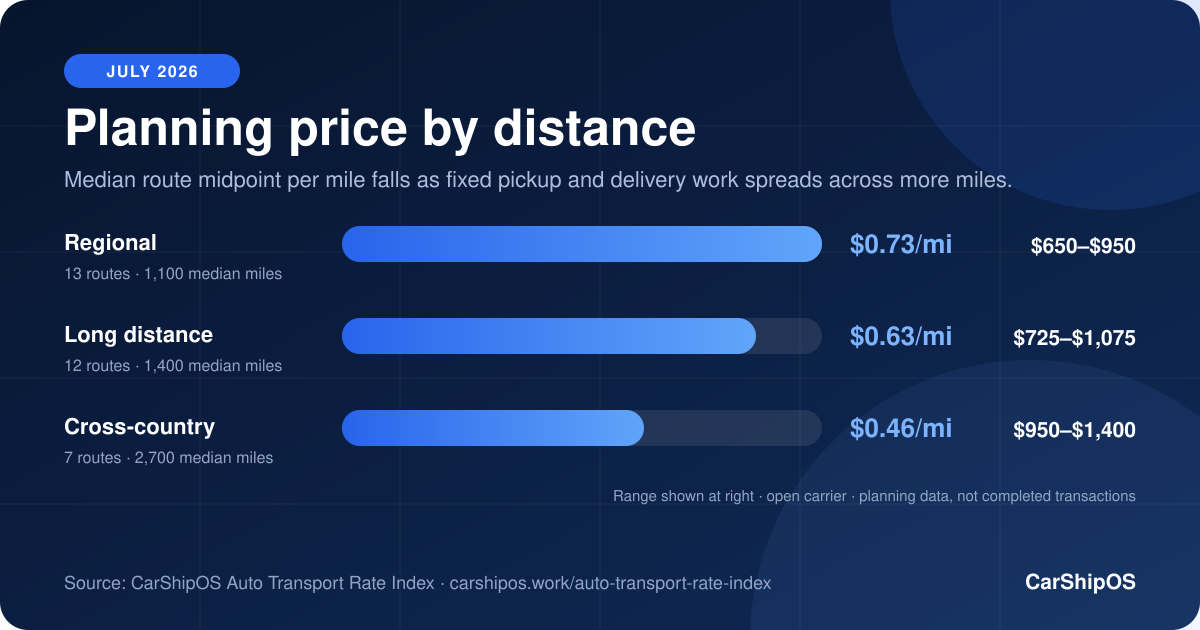
Regional
Median distance 1,100 mi
$650–$950
$0.73 median midpoint/mi
13 directional routes in sample
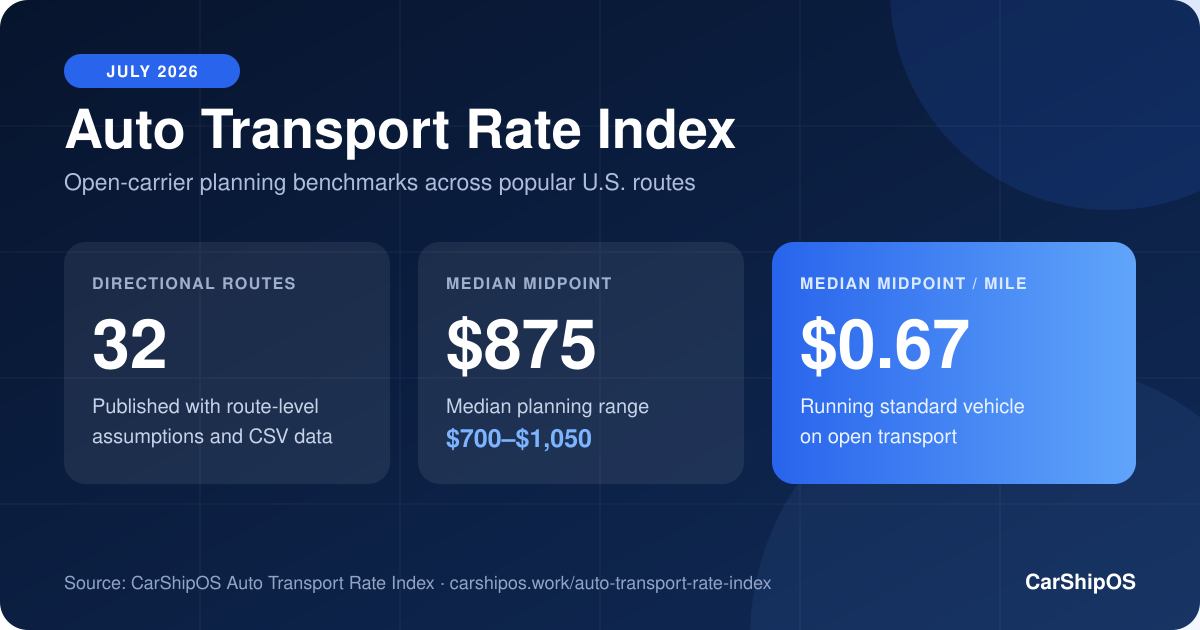
Directional planning ranges for 32 popular U.S. routes—published with the assumptions, calculations, and source rows needed to audit or cite the numbers.
What the index measures
This edition summarizes the route ranges already maintained by CarShipOS for consumer planning pages. It does not claim to represent every lane, every vehicle, or a transaction-weighted national average.
Median distance 1,100 mi
$650–$950
$0.73 median midpoint/mi
13 directional routes in sample
Median distance 1,400 mi
$725–$1,075
$0.63 median midpoint/mi
12 directional routes in sample
Median distance 2,700 mi
$950–$1,400
$0.46 median midpoint/mi
7 directional routes in sample
Source table
Routes are directional because seasonal demand and available carrier capacity can differ by direction.
| Route | Distance | Open planning range | Midpoint / mile | Transit |
|---|---|---|---|---|
| California → Florida | 2,700 mi | $1,000–$1,450 | $0.45 | 7–9 days |
| Florida → California | 2,700 mi | $950–$1,400 | $0.44 | 7–9 days |
| California → Texas | 1,400 mi | $700–$1,000 | $0.61 | 3–6 days |
| Texas → California | 1,400 mi | $700–$1,000 | $0.61 | 3–6 days |
| California → New York | 2,900 mi | $1,100–$1,550 | $0.46 | 7–9 days |
| New York → California | 2,900 mi | $1,100–$1,550 | $0.46 | 7–9 days |
| Florida → New York | 1,300 mi | $700–$1,050 | $0.67 | 3–5 days |
| New York → Florida | 1,300 mi | $700–$1,050 | $0.67 | 3–5 days |
| Florida → Texas | 1,200 mi | $650–$950 | $0.67 | 2–5 days |
| Texas → Florida | 1,200 mi | $650–$950 | $0.67 | 2–5 days |
| Illinois → Florida | 1,200 mi | $700–$1,000 | $0.71 | 3–5 days |
| Florida → Illinois | 1,200 mi | $700–$1,000 | $0.71 | 3–5 days |
| Arizona → Florida | 2,000 mi | $900–$1,300 | $0.55 | 5–7 days |
| California → Washington | 1,100 mi | $650–$950 | $0.73 | 2–4 days |
| Washington → California | 1,100 mi | $650–$950 | $0.73 | 2–4 days |
| Texas → New York | 1,600 mi | $800–$1,150 | $0.61 | 4–6 days |
| Florida → Michigan | 1,300 mi | $700–$1,050 | $0.67 | 3–5 days |
| Michigan → Florida | 1,300 mi | $700–$1,050 | $0.67 | 3–5 days |
| New York → Texas | 1,600 mi | $850–$1,200 | $0.64 | 4–6 days |
| California → Illinois | 2,000 mi | $900–$1,300 | $0.55 | 5–7 days |
| Illinois → California | 2,000 mi | $900–$1,300 | $0.55 | 5–7 days |
| Florida → New Jersey | 1,180 mi | $650–$1,000 | $0.70 | 3–5 days |
| New Jersey → Florida | 1,180 mi | $650–$1,000 | $0.70 | 3–5 days |
| Ohio → Florida | 1,000 mi | $650–$950 | $0.80 | 2–4 days |
| California → Arizona | 370 mi | $350–$550 | $1.22 | 1–2 days |
| Arizona → California | 370 mi | $350–$550 | $1.22 | 1–2 days |
| Georgia → California | 2,170 mi | $950–$1,350 | $0.53 | 5–7 days |
| California → Georgia | 2,170 mi | $950–$1,350 | $0.53 | 5–7 days |
| Pennsylvania → Florida | 1,100 mi | $650–$1,000 | $0.75 | 3–5 days |
| Florida → Pennsylvania | 1,100 mi | $650–$1,000 | $0.75 | 3–5 days |
| Massachusetts → Florida | 1,400 mi | $750–$1,100 | $0.66 | 3–5 days |
| Texas → Washington | 2,100 mi | $950–$1,350 | $0.55 | 5–7 days |
Edition July 2026 · Methodology v1.0 · U.S. dollars · Distance rounded to planning mileage
Publisher resources
Download either chart or copy its responsive embed code. Reuse is welcome with visible CarShipOS attribution and a link to this page, where readers can inspect the assumptions and source rows.
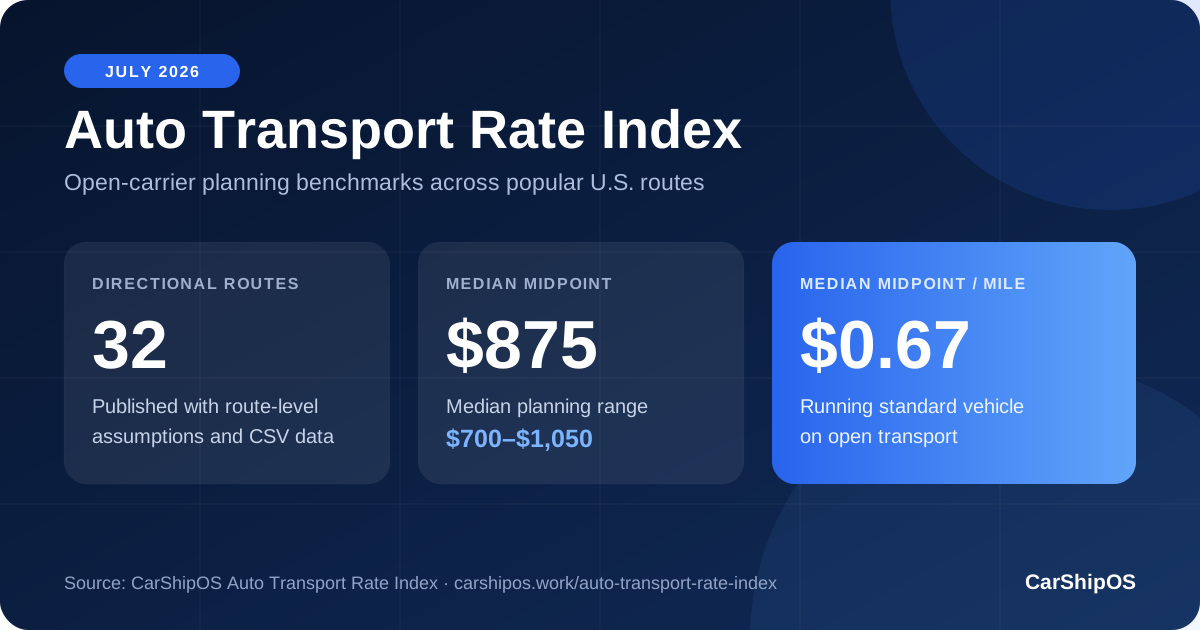
A share-ready overview of the route count, median planning range, midpoint, and midpoint per mile.
<a href="https://www.carshipos.work/auto-transport-rate-index"><img src="https://www.carshipos.work/data/rate-index-summary-july-2026.svg" alt="CarShipOS July 2026 Auto Transport Rate Index summary" width="1200" height="630"></a>
<p>Source: <a href="https://www.carshipos.work/auto-transport-rate-index">CarShipOS Auto Transport Rate Index — July 2026</a></p>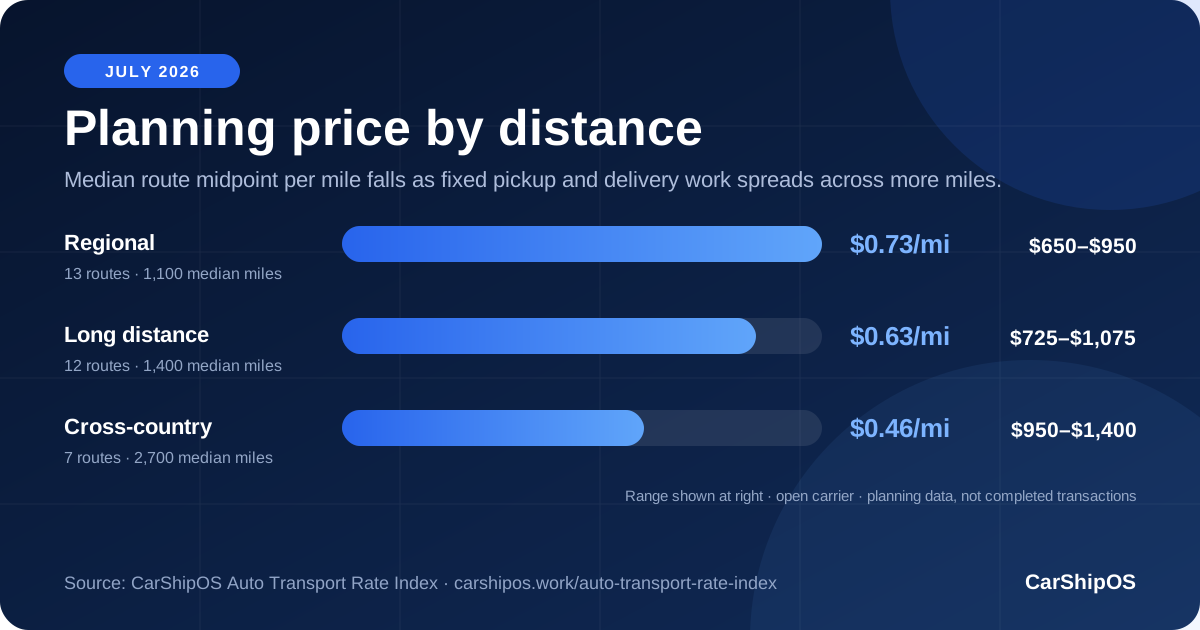
A comparison of regional, long-distance, and cross-country median planning benchmarks.
<a href="https://www.carshipos.work/auto-transport-rate-index"><img src="https://www.carshipos.work/data/rate-index-distance-july-2026.svg" alt="Auto transport planning price by distance for July 2026" width="1200" height="630"></a>
<p>Source: <a href="https://www.carshipos.work/auto-transport-rate-index">CarShipOS Auto Transport Rate Index — July 2026</a></p>
Please preserve the chart context: these are planning benchmarks for a running standard-size vehicle on open transport, not completed-transaction averages or guaranteed quotes.
Attribution helps readers find the assumptions and latest edition. Copy this suggested citation or link directly to the index.
No. This first edition summarizes CarShipOS planning ranges for 32 representative directional routes. It is an editorial planning dataset, not a transaction-weighted average or a live quote feed.
Every range assumes one running, standard-size vehicle moving on an open carrier. Larger, inoperable, expedited, enclosed, rural, or seasonally constrained shipments usually cost more.
Pickup and delivery create fixed work for a carrier. On a longer trip, that work is spread across more miles, so total price increases while the average price per mile commonly declines.
Yes. You may cite the index and use the downloadable CSV with attribution to CarShipOS and a link to this page. Do not present the planning ranges as completed-transaction averages.